ANALOG CONTROL PROJECT
DC Motor Speed Controller
Closed-loop analog PI control that holds a brushed DC motor at commanded speed under changing load.
For this electronics design project I designed, simulated, and built an electronic speed controller for a small brushed DC motor. A Hall-effect sensor on the shaft acts as a tachometer, a frequency-to-voltage converter turns its pulses into a feedback voltage, and an op-amp PI controller drives a MOSFET output stage from a 15 V supply so the shaft speed tracks the setpoint. The finished loop held steady-state speed within the ±10% requirement and switched cleanly between 2000 and 2400 rpm.
PI Control
Op-Amp Design
LTspice Simulation
Oscilloscope Testing
Sensor Feedback

The control loop, end to end
Difference amplifier, PI controller, MOSFET driver, and a simulated motor + tachometer model in LTspice.
View figures & test data ↓
How the Control Loop Works
Six stages take the loop from a voltage command to a regulated shaft speed. Every stage was designed at the component level and verified in simulation before the build.
Setpoint Command
An analog voltage Vset commands the target speed. Stepping it between 0.5 V and 0.6 V corresponds to switching the motor between roughly 2000 and 2400 rpm.
Hall-Effect Tachometer
A magnet on the motor shaft sweeps past a Hall-effect sensor once per revolution, producing a pulse train whose frequency is proportional to shaft speed.
Frequency-to-Voltage Converter
Converts the tachometer pulses into the feedback voltage Vref, designed for 1 V per 67 Hz and bench-calibrated at 65.49 Hz per volt.
Error Amplifier
A unity-gain difference amplifier with matched resistors computes the loop error directly: Vdiff = Vref − Vset.
PI Controller

A second op-amp referenced to ground integrates the error. R6/R5 sets a proportional gain of 56, and C1 smooths how fast the loop corrects.
MOSFET Motor Driver
A high-side source follower feeds the motor from the 15 V supply. As the controller output rises, the gate-source voltage self-adjusts and the drive settles at the required level.
Figures & Test Data
Simulation plots and oscilloscope captures from the report, spanning the first LTspice sweep to the measurements that verified the ±10% speed requirement.
LTspice schematic of the complete loop: difference amp, PI controller, MOSFET driver, and behavioral models for the motor and tachometer.

Simulated drive voltage snapping to the new operating point at a proportional gain of 56. Lowering the gain to 5 made settling visibly slower.
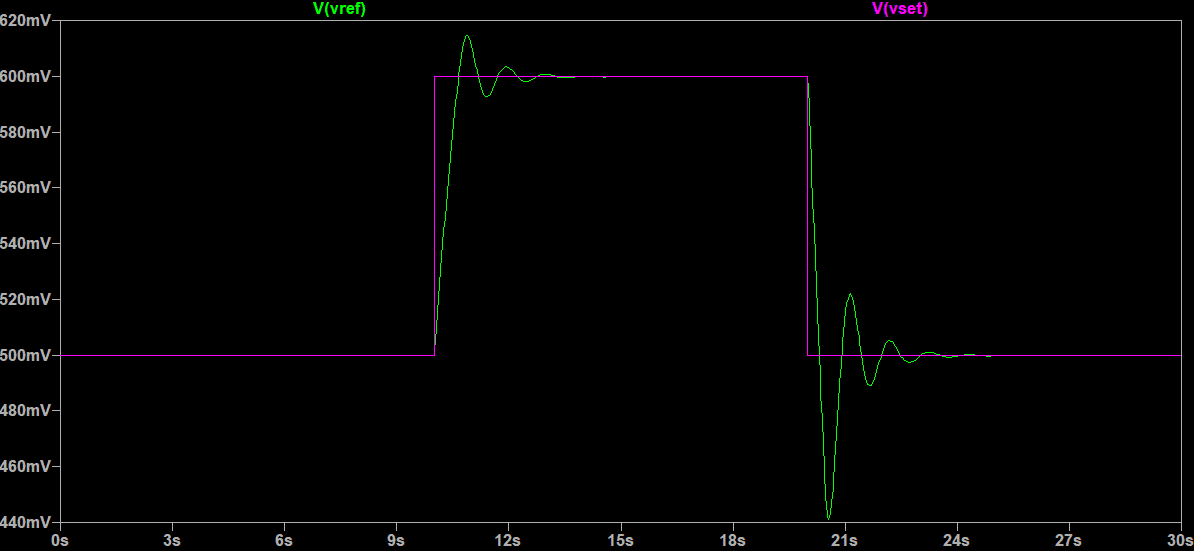
Vref locking onto Vset for 500 mV to 600 mV setpoint steps, confirming the loop model reaches steady state with matching voltages.

Bench measurement of Vref alternating between the 0.5 V and 0.6 V setpoints, the basis for the ±10% verification statistics.

Oscilloscope capture of the frequency-to-voltage converter output; a 67 Hz input measured 1.023 V, a 2.3% deviation from the design target.

Vref and Vset captured together while stepping the speed command, showing the feedback following each transition.
Design & Verification Process
01
Requirements & Targets
Defined the control goal: accept an analog speed command, hold steady-state speed within ±10% of the setpoint across the load range, and alternate cleanly between 2000 and 2400 rpm.
02
Controller Design
Built a unity-gain difference amplifier to compute the speed error and paired it with an op-amp PI stage — R6/R5 proportional gain plus an integrating capacitor — forming the complete analog controller.
03
Simulation in LTspice
Modeled the motor dynamics, Hall sensor, and F-to-V converter with behavioral sources, swept the proportional gain (56 vs. 5), and confirmed Vref settles onto Vset at steady state.
04
Frequency-to-Voltage Calibration
Drove the converter with known sine inputs on the bench; a 67 Hz input produced 1.023 V, giving a measured conversion ratio of 65.49 Hz per volt used to map voltage to rpm.
05
Bench Verification
Captured Vset and Vref on the oscilloscope while stepping the setpoint. At both operating points, over 97% of samples stayed within the ±10% requirement.
06
Load Testing
Progressively increased the mechanical load to find the limits of the loop, pushing the motor up to 100 mA of drive current before it could no longer follow the setpoint.
Measured Results
Verification against the project requirements: the steady-state difference between Vset and Vref stayed within ±10% at every tested operating point.
0.5 V SETPOINT
0.4926 V
Mean measured Vref of 0.4926 V with 97.6% of samples inside the ±10% band. Requirement met.
0.6 V SETPOINT
0.5920 V
Mean measured Vref of 0.5920 V with 97.9% of samples inside the ±10% band. Requirement met.
SPEED RANGE
2026–2433 rpm
Using the measured 65.49 Hz/V conversion ratio, the operating points map to shaft speeds satisfying the 2000/2400 rpm targets.
F-TO-V RATIO
65.49 Hz/V
Bench-calibrated conversion ratio, 2.3% from the 67 Hz/V design value, small enough to verify speed directly from Vref.
Possible Improvements
Where the design goes next. Each item comes straight from what the simulation and bench data revealed.
Tighter F-to-V Calibration
Adjust the converter resistor values so the measured conversion ratio lands on the 67 Hz/V design target instead of 2.3% below it.
Full PID Control
Add a differentiator to the existing PI stage to damp transients faster and measure the improvement in setpoint response.
PWM Motor Drive
Replace the linear MOSFET follower with a PWM-based driver for higher efficiency and a wider usable control range.
Output Filtering
Add an RC low-pass filter after the F-to-V converter to deliver a smoother, less noisy Vref into the error amplifier.
Skills Demonstrated
The engineering capabilities this project exercised, from first schematic to verified hardware.
Analog Circuit Design
Designed op-amp difference and PI stages and a high-side MOSFET drive stage running from ±15 V supplies.
Control Systems
Applied closed-loop feedback theory: error amplification, proportional-integral tuning, and steady-state error analysis.
SPICE Simulation
Built behavioral models of motor dynamics and sensor stages in LTspice and swept controller gains before committing to hardware.
Test & Measurement
Captured and interpreted oscilloscope traces, then verified performance statistically against a ±10% specification.
Sensor Integration
Implemented a Hall-effect tachometer with frequency-to-voltage conversion and calibrated it against known inputs.
Data Analysis
Quantified tracking accuracy across operating points, converting raw measurements into requirement-level pass/fail evidence.
What I Learned
This project connected control theory to physical hardware. Concepts like proportional gain and integral action became visible behavior on an oscilloscope: overshoot, settling, and steady-state error I could tune with real resistor values. Just as importantly, it taught me to verify: not to claim the loop works, but to measure how well, against a written requirement.
Practical takeaways
Proportional gain trades response speed against stability. A gain of 56 settled fast where 5 crawled.
Hardware never matches design values exactly; measure the real conversion ratio and use it.
Oscilloscope statistics turn a working demo into quantitative, requirement-level evidence.
Behavioral SPICE models of motors and sensors make simulation predict bench results closely.
Every driver stage has a load limit. Find it deliberately instead of discovering it by accident.
Outcome Summary
The closed-loop controller was tested by measuring the command voltage Vset against the feedback voltage Vref at two operating points, 0.5 V and 0.6 V. Average Vref values of 0.493 V and 0.592 V landed within the ±10% requirement, and applying the measured 65.49 Hz/V conversion ratio put the shaft between 2026 and 2433 rpm, meeting the project requirement for commanded motor speed.
Why This Project Matters
This is a complete feedback system, from sensor and signal conditioning to controller and power stage, designed, simulated, built, and verified against a written specification. The same loop appears in industrial motor drives, robotics joints, cooling systems, and precision actuators. Delivering it end to end demonstrates I can move between control theory, circuit design, and disciplined lab verification on one problem.
Interested in my engineering projects?
View my other projects or contact me to learn more about my technical experience.
ANALOG CONTROL PROJECT
DC Motor Speed Controller
Closed-loop analog PI control that holds a brushed DC motor at commanded speed under changing load.
For this electronics design project I designed, simulated, and built an electronic speed controller for a small brushed DC motor. A Hall-effect sensor on the shaft acts as a tachometer, a frequency-to-voltage converter turns its pulses into a feedback voltage, and an op-amp PI controller drives a MOSFET output stage from a 15 V supply so the shaft speed tracks the setpoint. The finished loop held steady-state speed within the ±10% requirement and switched cleanly between 2000 and 2400 rpm.
PI Control
Op-Amp Design
LTspice Simulation
Oscilloscope Testing
Sensor Feedback
The control loop, end to end
Difference amplifier, PI controller, MOSFET driver, and a simulated motor + tachometer model in LTspice.
View figures & test data ↓
How the Control Loop Works
Six stages take the loop from a voltage command to a regulated shaft speed. Every stage was designed at the component level and verified in simulation before the build.
Setpoint Command
An analog voltage Vset commands the target speed. Stepping it between 0.5 V and 0.6 V corresponds to switching the motor between roughly 2000 and 2400 rpm.
Hall-Effect Tachometer
A magnet on the motor shaft sweeps past a Hall-effect sensor once per revolution, producing a pulse train whose frequency is proportional to shaft speed.
Frequency-to-Voltage Converter
Converts the tachometer pulses into the feedback voltage Vref, designed for 1 V per 67 Hz and bench-calibrated at 65.49 Hz per volt.
Error Amplifier
A unity-gain difference amplifier with matched resistors computes the loop error directly: Vdiff = Vref − Vset.
PI Controller
A second op-amp referenced to ground integrates the error. R6/R5 sets a proportional gain of 56, and C1 smooths how fast the loop corrects.
MOSFET Motor Driver
A high-side source follower feeds the motor from the 15 V supply. As the controller output rises, the gate-source voltage self-adjusts and the drive settles at the required level.
Figures & Test Data
Simulation plots and oscilloscope captures from the report, spanning the first LTspice sweep to the measurements that verified the ±10% speed requirement.
LTspice schematic of the complete loop: difference amp, PI controller, MOSFET driver, and behavioral models for the motor and tachometer.
Simulated drive voltage snapping to the new operating point at a proportional gain of 56. Lowering the gain to 5 made settling visibly slower.
Vref locking onto Vset for 500 mV to 600 mV setpoint steps, confirming the loop model reaches steady state with matching voltages.
Bench measurement of Vref alternating between the 0.5 V and 0.6 V setpoints, the basis for the ±10% verification statistics.
Oscilloscope capture of the frequency-to-voltage converter output; a 67 Hz input measured 1.023 V, a 2.3% deviation from the design target.
Vref and Vset captured together while stepping the speed command, showing the feedback following each transition.
Design & Verification Process
01
Requirements & Targets
Defined the control goal: accept an analog speed command, hold steady-state speed within ±10% of the setpoint across the load range, and alternate cleanly between 2000 and 2400 rpm.
02
Controller Design
Built a unity-gain difference amplifier to compute the speed error and paired it with an op-amp PI stage — R6/R5 proportional gain plus an integrating capacitor — forming the complete analog controller.
03
Simulation in LTspice
Modeled the motor dynamics, Hall sensor, and F-to-V converter with behavioral sources, swept the proportional gain (56 vs. 5), and confirmed Vref settles onto Vset at steady state.
04
Frequency-to-Voltage Calibration
Drove the converter with known sine inputs on the bench; a 67 Hz input produced 1.023 V, giving a measured conversion ratio of 65.49 Hz per volt used to map voltage to rpm.
05
Bench Verification
Captured Vset and Vref on the oscilloscope while stepping the setpoint. At both operating points, over 97% of samples stayed within the ±10% requirement.
06
Load Testing
Progressively increased the mechanical load to find the limits of the loop, pushing the motor up to 100 mA of drive current before it could no longer follow the setpoint.
Measured Results
Verification against the project requirements: the steady-state difference between Vset and Vref stayed within ±10% at every tested operating point.
0.5 V SETPOINT
0.4926 V
Mean measured Vref of 0.4926 V with 97.6% of samples inside the ±10% band. Requirement met.
0.6 V SETPOINT
0.5920 V
Mean measured Vref of 0.5920 V with 97.9% of samples inside the ±10% band. Requirement met.
SPEED RANGE
2026–2433 rpm
Using the measured 65.49 Hz/V conversion ratio, the operating points map to shaft speeds satisfying the 2000/2400 rpm targets.
F-TO-V RATIO
65.49 Hz/V
Bench-calibrated conversion ratio, 2.3% from the 67 Hz/V design value, small enough to verify speed directly from Vref.
Possible Improvements
Where the design goes next. Each item comes straight from what the simulation and bench data revealed.
Tighter F-to-V Calibration
Adjust the converter resistor values so the measured conversion ratio lands on the 67 Hz/V design target instead of 2.3% below it.
Full PID Control
Add a differentiator to the existing PI stage to damp transients faster and measure the improvement in setpoint response.
PWM Motor Drive
Replace the linear MOSFET follower with a PWM-based driver for higher efficiency and a wider usable control range.
Output Filtering
Add an RC low-pass filter after the F-to-V converter to deliver a smoother, less noisy Vref into the error amplifier.
Skills Demonstrated
The engineering capabilities this project exercised, from first schematic to verified hardware.
Analog Circuit Design
Designed op-amp difference and PI stages and a high-side MOSFET drive stage running from ±15 V supplies.
Control Systems
Applied closed-loop feedback theory: error amplification, proportional-integral tuning, and steady-state error analysis.
SPICE Simulation
Built behavioral models of motor dynamics and sensor stages in LTspice and swept controller gains before committing to hardware.
Test & Measurement
Captured and interpreted oscilloscope traces, then verified performance statistically against a ±10% specification.
Sensor Integration
Implemented a Hall-effect tachometer with frequency-to-voltage conversion and calibrated it against known inputs.
Data Analysis
Quantified tracking accuracy across operating points, converting raw measurements into requirement-level pass/fail evidence.
What I Learned
This project connected control theory to physical hardware. Concepts like proportional gain and integral action became visible behavior on an oscilloscope: overshoot, settling, and steady-state error I could tune with real resistor values. Just as importantly, it taught me to verify: not to claim the loop works, but to measure how well, against a written requirement.
Practical takeaways
Proportional gain trades response speed against stability. A gain of 56 settled fast where 5 crawled.
Hardware never matches design values exactly; measure the real conversion ratio and use it.
Oscilloscope statistics turn a working demo into quantitative, requirement-level evidence.
Behavioral SPICE models of motors and sensors make simulation predict bench results closely.
Every driver stage has a load limit. Find it deliberately instead of discovering it by accident.
Outcome Summary
The closed-loop controller was tested by measuring the command voltage Vset against the feedback voltage Vref at two operating points, 0.5 V and 0.6 V. Average Vref values of 0.493 V and 0.592 V landed within the ±10% requirement, and applying the measured 65.49 Hz/V conversion ratio put the shaft between 2026 and 2433 rpm, meeting the project requirement for commanded motor speed.
Why This Project Matters
This is a complete feedback system, from sensor and signal conditioning to controller and power stage, designed, simulated, built, and verified against a written specification. The same loop appears in industrial motor drives, robotics joints, cooling systems, and precision actuators. Delivering it end to end demonstrates I can move between control theory, circuit design, and disciplined lab verification on one problem.
Interested in my engineering projects?
View my other projects or contact me to learn more about my technical experience.